The cryptocurrency market, led by the largest cryptocurrencies Bitcoin (BTC) and Ethereum (ETH), surged on Tuesday to levels not seen in over a month in anticipation of the Federal Reserve’s (Fed) imminent announcement of its first interest rate cut since the COVID-19 pandemic.
However, despite these expectations or what the outcome of the Fed’s announcement could have on the market, on Bitcoin Halving years, the fourth quarter (Q4) is usually significantly bullish for the two largest digital assets and the broader market.
Exploring The Ethereum Price Performance Post-Bitcoin Halving
Interestingly, Ethereum’s performance following past Bitcoin Halving events has displayed notable variations. Data reveals that in the year following the 2016 Halving, Ethereum experienced a 45% drawdown before embarking on a notable rally that culminated in a 3,400% increase.
Similarly, after the 2020 Halving, ETH surged by 150% before rocketing to a 2,150% gain. However, since the latest Halving in April, ETH has mirrored Bitcoin’s volatility, encountering notable price fluctuations and establishing lower support levels.
Related Reading
The recent month has not been kind to Ethereum, marked by two significant crashes. On August 5, ETH retraced over 25%, plummeting to a six-month low of $2,110. The downward trend continued into September, with increased selling pressure leading to a drop from $2,800 to approximately $2,150 in just one week.
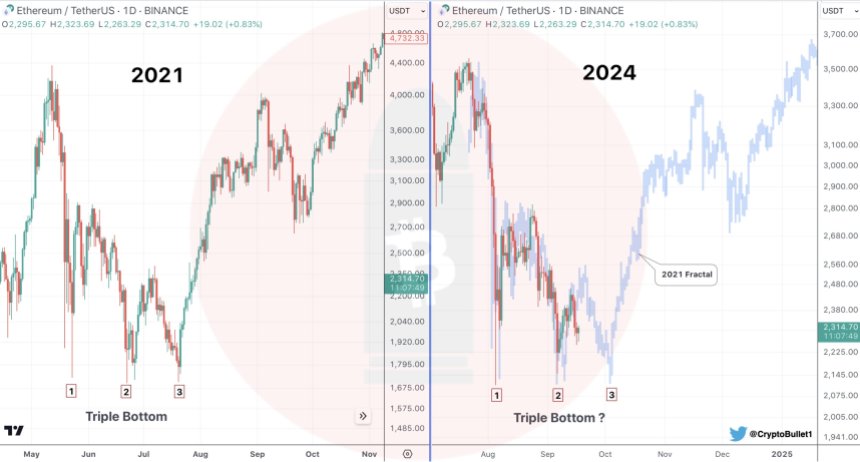
Despite these challenges, analyst CryptoBullet remains optimistic about Q4’s potential for a turnaround. Notably, the analyst identified a “triple bottom” formation on the ETH/USDT daily chart see in the image below, reminiscent of price action observed in 2021.

This pattern suggests that Ethereum may be poised for a rebound similar to that seen in 2021, when it surged from around $1,650 to its all-time high of $4,730. Yet, currently trading at approximately $2,330, Ethereum sits over 52% below its previous all-time high.
ETH Price Analysis
Predicting further price volatility for ETH on Wednesday ahead of the upcoming Fed rate cut, there are key levels to monitor. In the past week, ETH has established the $2,260 mark as a significant support level. This price point is crucial, as it could act as a buffer against a further decline toward $2,200 or even a retest of the next major support at $2,100.
On the upside, the 50-day exponential moving average (EMA) is currently positioned at $2,350, serving as a formidable barrier for Ethereum. This resistance level has been preventing the cryptocurrency from retesting the $2,400 mark in the near term.
Related Reading
Should ETH manage to break above these resistance levels, bullish investors will set their sights on the next major resistance at $2,520. Just above this level lies another critical hurdle at $2,620, where the 200-day EMA is situated. This level has not been surpassed since July of this year, when Ethereum’s price fell below it, initiating the current downtrend.
Featured image from DALL-E, chart from TradingView.com
